
Figure 3.
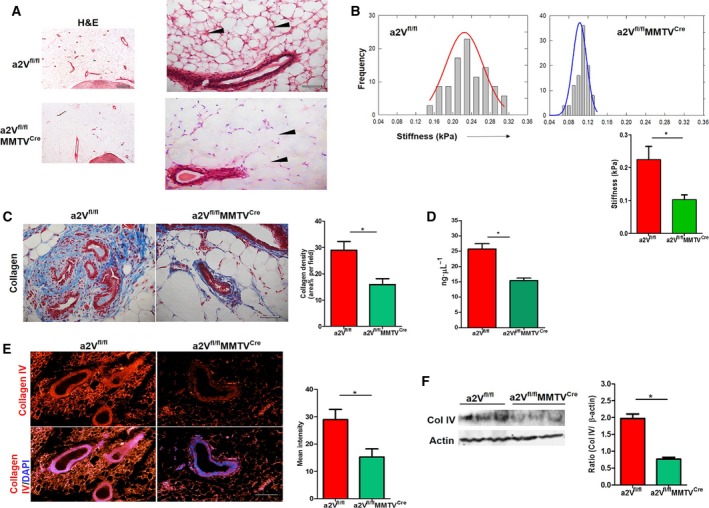
Breast tissue ECM of a2V‐knockout (a2Vfl/fl MMTVC re) mice displays reduced density and stiffness: (A) Representative images showing ECM density difference (black arrow head) in breast tissue sections from a2Vfl/fl or a2Vfl/fl MMTVC re mice by hematoxylin and eosin staining. n = 8, magnification 4× and 20×, scale bar 500 and 100 μm. (B) Stiffness distribution of normal breast tissues from a2Vfl/fl or a2Vfl/fl MMTVC re mice measured by atomic force microscopy. Single peaks demonstrate characteristic unimodal stiffness profile of normal breast tissue. Tissue stiffness data are represented in kPa, mean ± SD, n = 5, *P < 0.05. (C) Representative images of Mason trichrome staining of total collagen content in normal as well as tumorous breast tissues from a2Vfl/fl or a2Vfl/fl MMTVC re mice. The blue color shows staining for collagen protein, and red color shows cytoplasm. n = 7 each group, magnification 10×, scale bar 200 μm. Graph shows quantification of collagen density. Values are presented as mean ± SE, n = 7 each group, *P < 0.05. (D) Graph shows total hydroxyproline amino acid content in normal as well as tumorous breast tissues from a2Vfl/fl or a2Vfl/fl MMTVC re mice measured by hydroxyproline assay. Values presented as mean ± SE, n = 12 and 15, *P < 0.05. (E) Representative images of immunofluorescence analysis of collagen IV protein expression in normal breast tissue sections from a2Vfl/fl or a2Vfl/fl MMTVC re mice. The red color shows positive staining for collagen IV protein, and blue color shows DAPI staining for the nucleus, magnification 10×, scale bar 200 μm. (F) Western blot showing collagen IV protein expression in protein lysates prepared from a2Vfl/fl or a2Vfl/fl MMTVC re mice breast tissues. n = 3 each group, *P < 0.05. Protein concentrations were normalized using β‐actin.