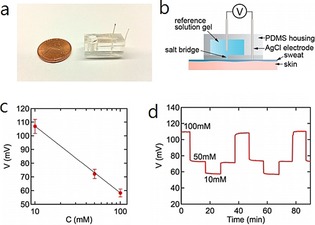
Figure 19.

Chloride sensor for on‐body sweat tests. a) Photograph of a sensor. b) Schematic illustration of the sensor with an optimized salt bridge. c) Representative calibration curve (N=13). d) Representative dose–response curve. Reproduced from Ref. 66 with permission of the American Chemical Society.
