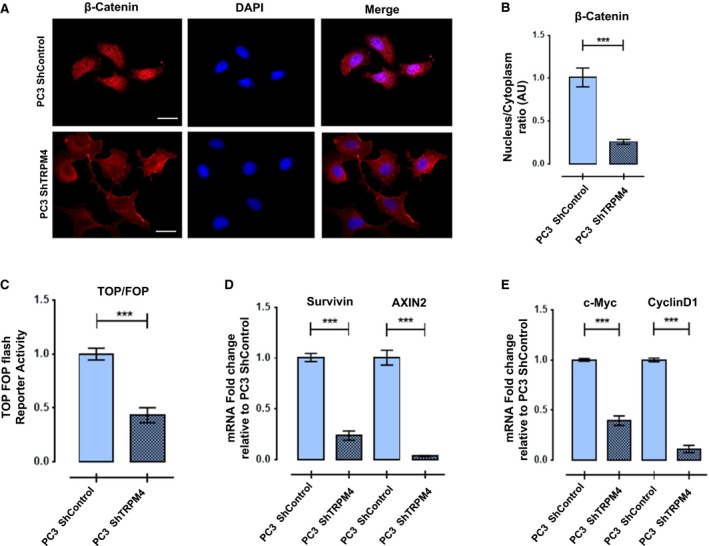
Figure 2.

TRPM4 expression effects, nuclear distribution, and transcriptional activity of β‐catenin. (A, B) Knockdown of TRPM4 in PC3 cells decreases β‐catenin nuclear localization. Representative images of intracellular β‐catenin detected by immunofluorescence in PC3 ShControl (upper) and PC3 ShTRPM4 (bottom). Scale bar 20 μm. Graph shows arbitrary units of fluorescence of β‐catenin nuclear/cytoplasmic ratio quantified in at least three independent experiments. Mean ± SEM are shown. T‐test with Welch correction, ***P ≤ 0.001. (C) Knockdown of TRPM4 in PC3 cells decreases β‐catenin cotranscriptional activity. PC3 ShTRPM4 and PC3 ShControl cells were transfected with plasmid pTOP or pFOP and pTK‐Renilla as normalizer. Normalized TOP/FOP Luciferase activity is shown. T‐test with Welch correction, ***P ≤ 0.001. (D, E) Relative mRNA expression of β‐catenin target genes. Axin2, survivin, c‐Myc, and cyclin D1 genes were analyzed in PC3 ShTRPM4 compared to PC3 ShControl cells with RT‐qPCR assay. All experiments were performed at least three times. Mean ± SEM are shown. T‐test with Welch correction, ***P ≤ 0.001.
