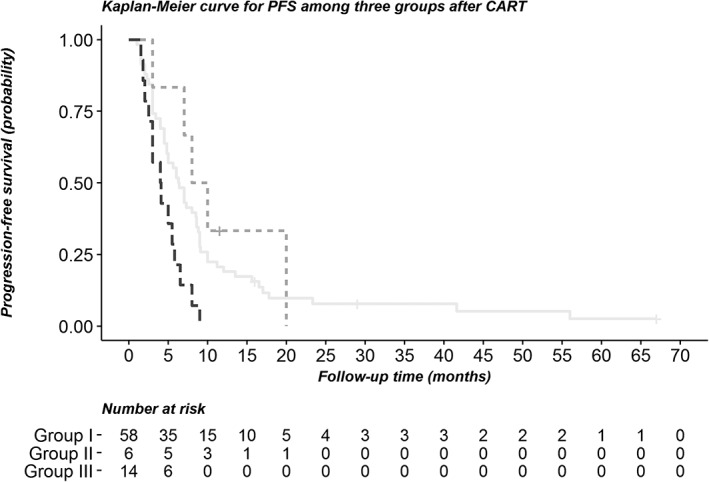
Figure 4.

Kaplan‐Meier curve for progression‐free survival between the groups after classification regression tree analysis. ( ) Group I, (
 ) Group II, and (
 ) Group III.

Kaplan‐Meier curve for progression‐free survival between the groups after classification regression tree analysis. ( ) Group I, (
 ) Group II, and (
 ) Group III.