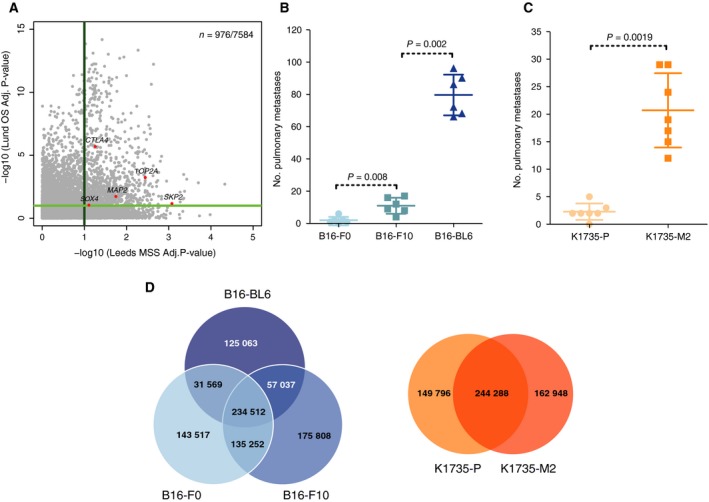
Figure 1.

Patient sample and mouse cell line characteristics. (A) Scatter plot showing the −log10‐corrected P‐values for the 7584 genes analysed in both cohorts in association with melanoma‐specific survival in the Leeds cohort (x‐axis) and overall survival in the Lund cohort (y‐axis). (B‐C) Experimental metastasis assay using (B) B16 cell lines and (C) K1735 cell lines in wild‐type female mice (symbols representing individual mice with horizontal bar at the mean ± SD and statistics performed using a Mann–Whitney test; data shown are representative of two independent experiments). (D) Venn diagrams showing the number of variants shared between the mouse melanoma cell lines.
