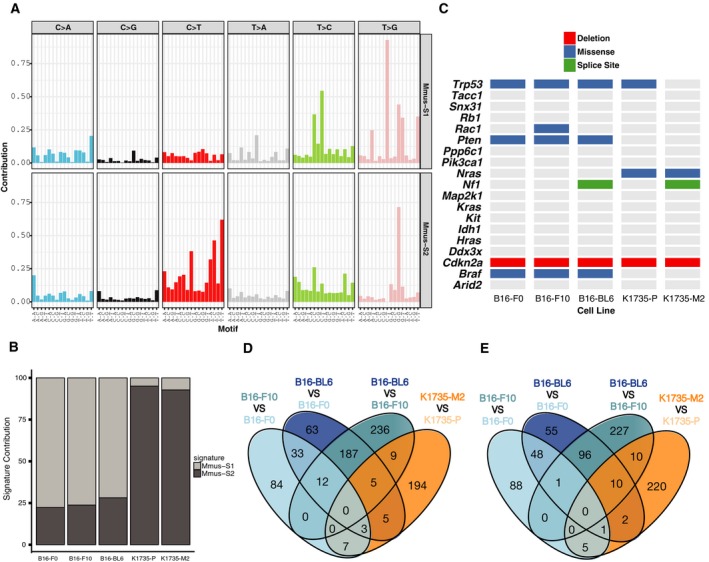
Figure 2.

Characterisation of mouse melanoma cell line series. (A) Somatic mutational signatures operative in the genomes of mouse melanoma cell lines. (B) Signature contribution in the mouse melanoma cell line genomes for each process identified. (C) Matrix showing the mutations in known melanoma driver genes found in mouse melanoma cell lines. Venn diagrams showing the number of genes identified as differentially (D) overexpressed or (E) underexpressed across the multiple paired comparisons between a cell line with higher metastatic potential and its parental line.
