Figure 3.

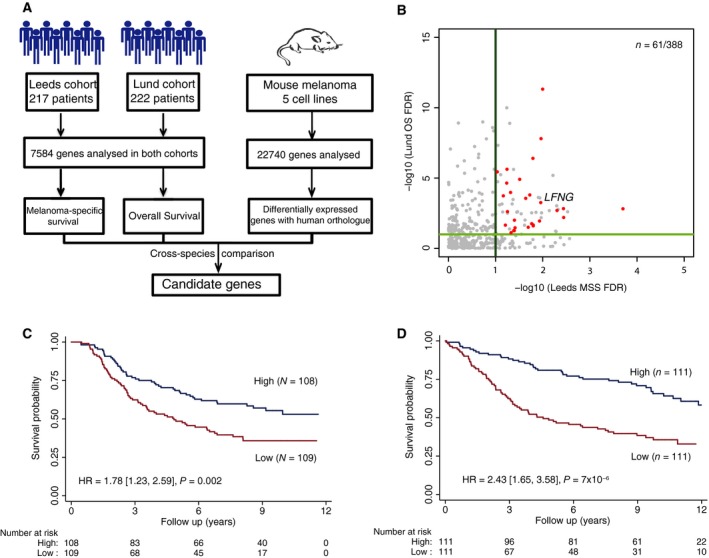
Cross‐species metastasis colonisation gene candidate identification. (A) Diagram showing the cross‐species approach used to identify gene candidates. (B) Scatter plot showing the corrected P‐values (−log10) obtained from the survival analysis for the 388 genes that can be analysed in both human patient cohorts and whose orthologue in mouse were identified as differentially expressed in metastatic cell lines. In red, genes with concordance between the expression changes in the mouse cell lines comparisons and the gene levels associated with poor outcome in both patient cohorts with an FDR < 0.1 are shown. (C) Kaplan–Meier curve showing the melanoma‐specific patient survival in the Leeds cohort when stratified by LFNG expression. (D) Kaplan–Meier curve showing the overall patient survival in the Lund cohort when stratified by LFNG expression. The plots show the results when the data are stratified by median expression into high and low LFNG expression groups. The hazard ratio shown is for the low expression group vs the high expression group.
