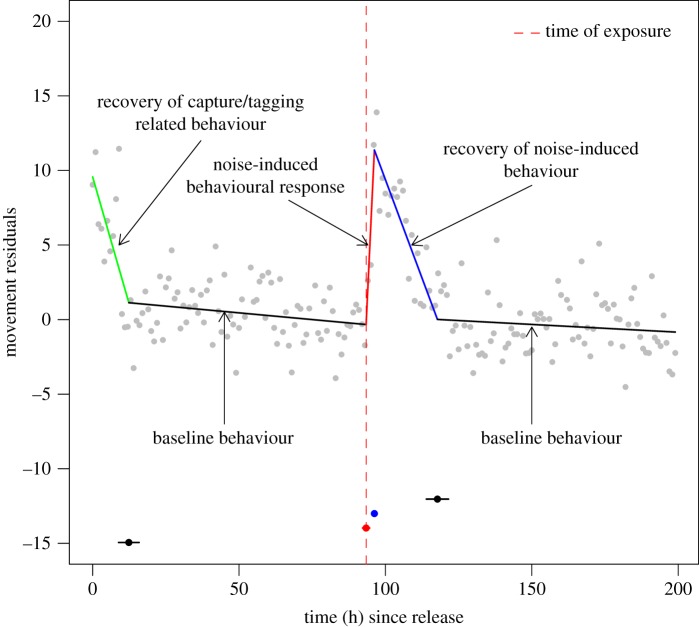
Figure 2.
Illustration of a potential response to capture/tagging and short-term underwater noise for a given movement parameter (e.g. speed between GPS relocations) of a harbour porpoise individual as modelled with piecewise linear regression. The duration of the recovery of capture/tagging-related behaviour may be quantified by calculating the time difference between breakpoint 1 (black) and time of release (0 h). The duration of a noise-induced behavioural response may be quantified by calculating the time difference between breakpoint 3 (blue) and breakpoint 2 (red) but only if the second breakpoint (red) coincides with the time of exposure (vertical dashed line). The duration of the recovery of noise-induced behaviour may be quantified by calculating the time difference between breakpoint 4 (black) and breakpoint 3 (blue). Note that the slope of the regression lines may vary depending on the movement parameter analysed and the individual-specific response.

