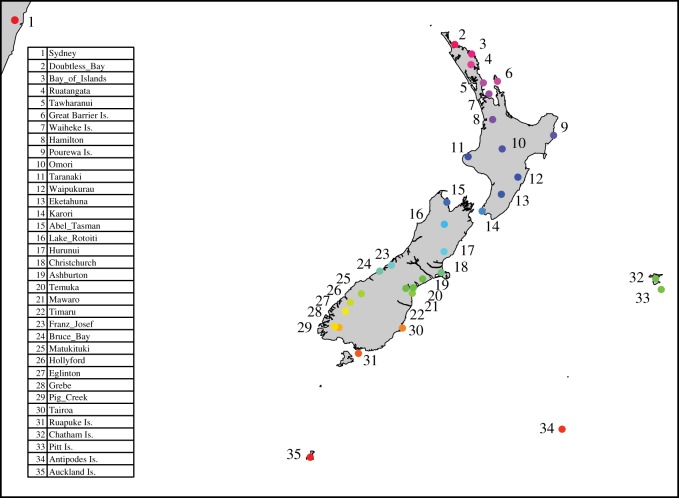
Figure 1.
Sampling locations for genomic genotyping. For the mitochondrial dataset, data from King et al. [55] was also included (q.v. for map and further details on those sample sites). Colour codes are based on latitude and used to help display relationships between sampling locations in future figures.

