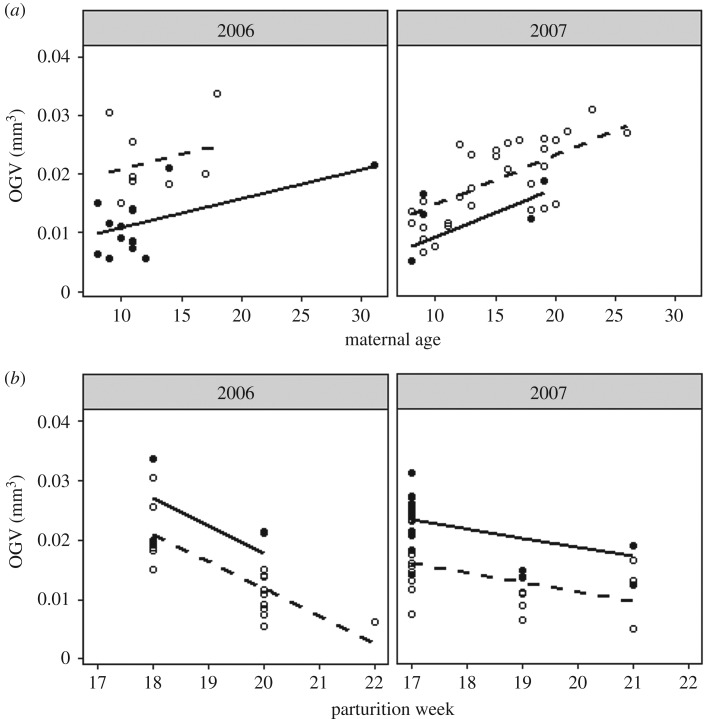
Figure 5.
Model prediction lines depicting the relationship between maternal age and OGV for both early (dashed line, weeks 17–19) and late (solid line, weeks 20–22) parturiating females, and the relationship between week of parturition and OGV for both ‘young’ (dashed line) and ‘old’ (solid line, 15+ years) females.

