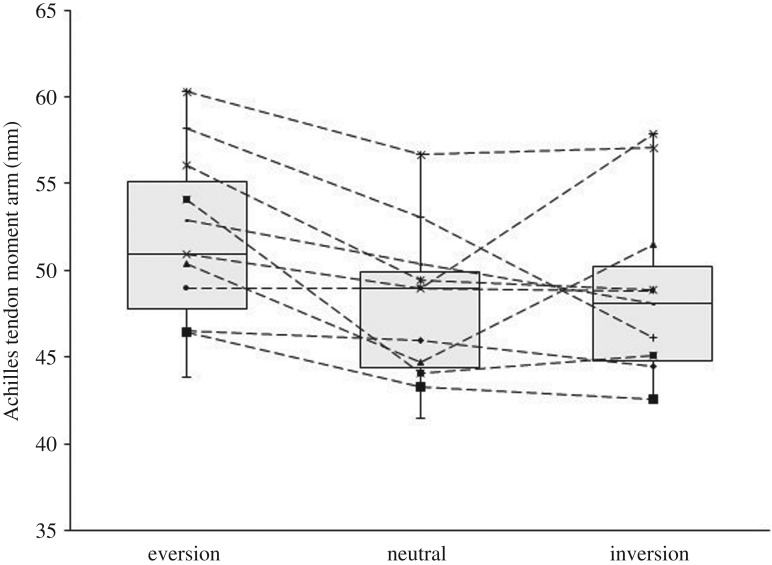
Figure 2.
Box-and-whisker plot of AT moment arm in calcaneal neutral, inversion and eversion positions. One box shows the data distribution for one foot position as first, median and third quartile. Whiskers represent the variability of the data as 1.5 times the interquartile range. Line graphs represent individual participants. The differences in AT moment arm in everted, neutral and inverted positions were not statistically significant (p > 0.05, n = 12).

