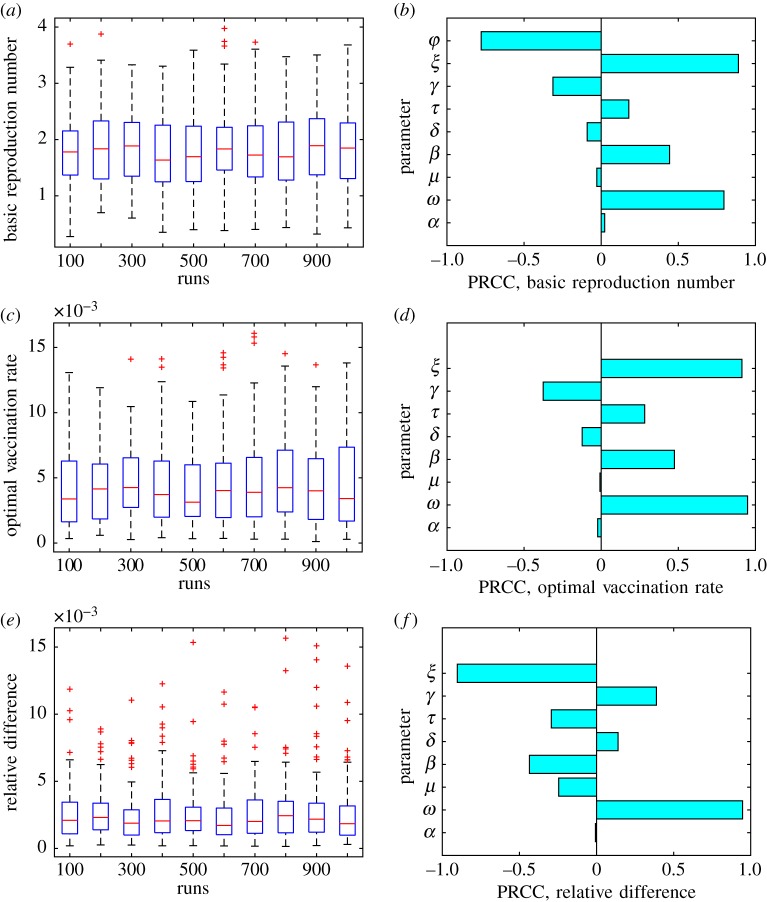
Figure 4.
Results of the uncertainty (a,c,e) and sensitivity (b,d,f) analysis. Three response functions were considered: (i) the basic reproduction number (a) and (b); (ii) the optimal vaccination rate φNE (c) and (d) and (iii) the relative difference between the herd immunity vaccination rate and the optimal vaccination rate (φHI−φNE)/φHI (e) and (f). The value C=10−4 was used for the response functions (ii) and (iii).

