Figure 5.
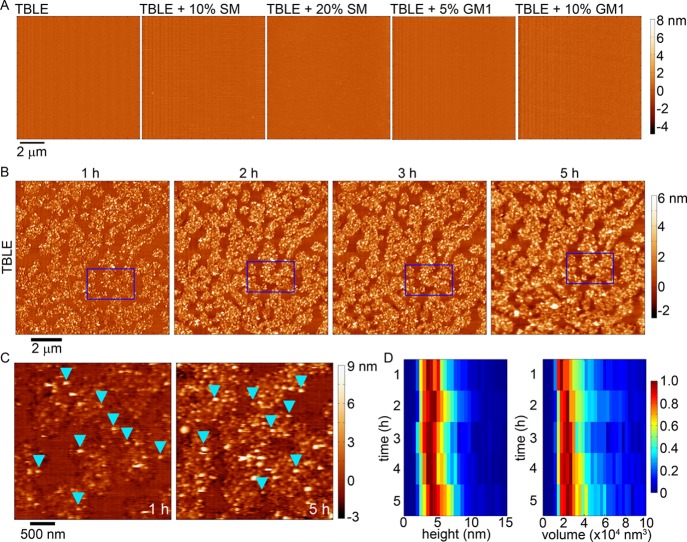
(A) AFM height images taken in-solution of continuous, supported lipid bilayers of TBLE, TBLE + 10% SM, TBLE + 20% SM, TBLE + 5% GM1, and TBLE + 10% GM1 prior to exposure to any htt-exon1(51Q). (B) Sequential AFM height images taken in-solution of supported TBLE bilayers exposed to htt-exon1(51Q). Blue rectangles identify the same region of the surface in the sequential images. (C) Zoomed-in AFM images demonstrating the rough, grainy morphological changes induced in a pure TBLE bilayer by htt-exon1(51Q). Blue arrows indicate oligomeric aggregates. (D) Height and volume histograms of oligomeric aggregates observed on TBLE bilayers presented as a function of time. To ease visualization, the histograms were normalized for each time point by setting the value of the most common height or volume to 1.

