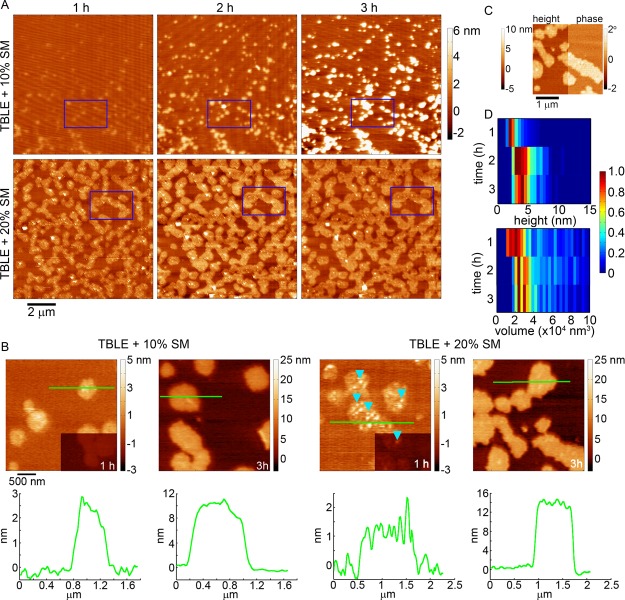
Figure 6.
(A) Sequential AFM height images taken in-solution of supported TBLE bilayers enriched with either 10 or 20% SM exposed to htt-exon1(51Q). Blue rectangles identify the same region of the surface in the sequential images. (B) Zoomed-in AFM images demonstrating the morphological changes induced in TBLE bilayers enriched in SM. Blue arrows indicate oligomeric aggregates. Green lines correspond to the height profiles presented directly below the images. The lower right corners of the images for the 1 h time point are presented at the same height scale as the 3 h images for easier comparison. (C) AFM image split into height and phase data of a region of a TBLE + 20% SM bilayer exposed to htt-exon1(51Q). (D) Height and volume histograms of oligomeric aggregates observed on TBLE bilayers enriched with 20% SM, presented as a function of time. To ease visualization, the histograms were normalized for each time point by setting the value of the most common height or volume to 1.

