
Figure 3.
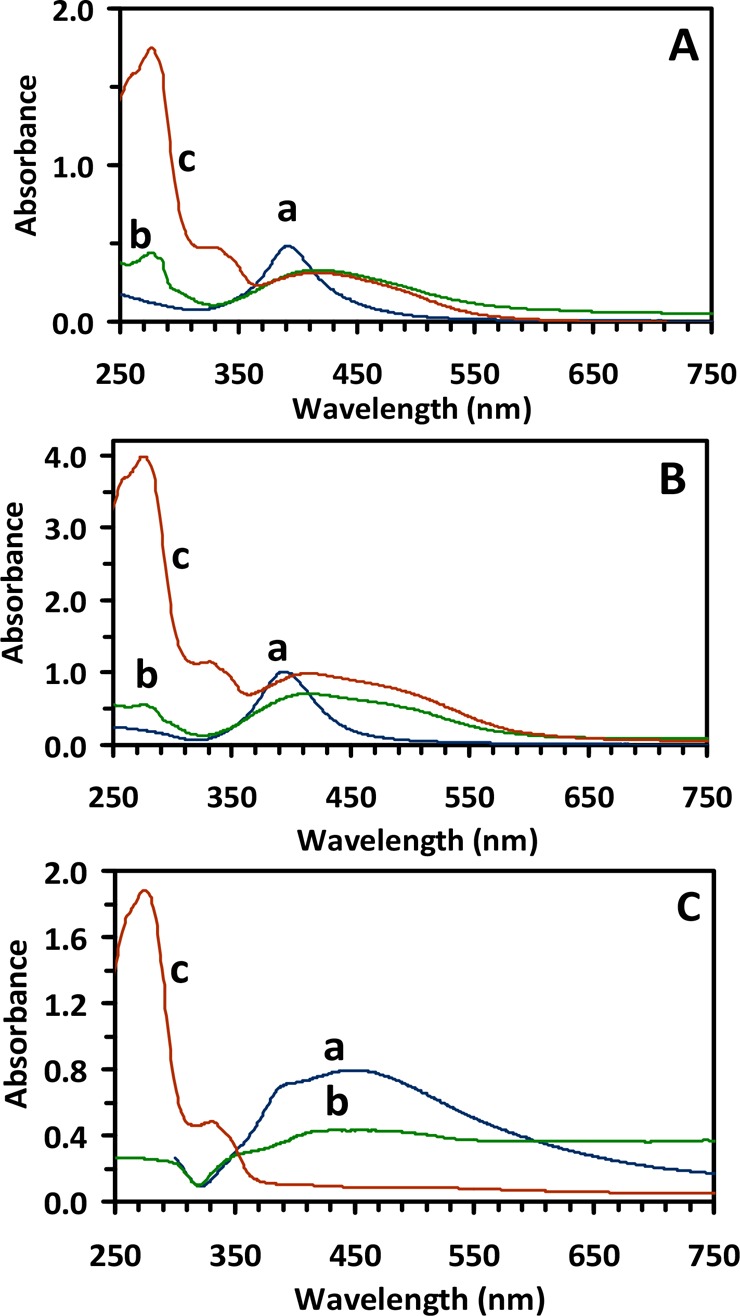
Characterization of conjugation ratios of Oflx molecules with NPs for three different sized Ag NPs using UV–vis absorption spectroscopy. (A) UV–vis absorption spectra of (a) 2.4 ± 0.7 nm Ag NPs, (b) AgMUNH2 NPs, and (c) AgMUNH-Oflx NPs show plasmonic absorption peak wavelengths (λmax) of the NPs at 392, 413, and 416 nm, respectively. (B) UV–vis absorption spectra of (a) 13.0 ± 3.1 nm Ag NPs, (b) AgMUNH2 NPs, and (c) AgMUNH-Oflx NPs show plasmonic absorption λmax of the NPs at 394, 414, and 418 nm, respectively. (C) UV–vis absorption spectra of (a) 92.6 ± 4.4 nm Ag NPs, (b) AgMUNH2 NPs, and (c) AgMUNH-Oflx NPs show plasmonic absorption λmax of the NPs at 450, 453, and 486 nm, respectively. Note that signature absorption λmax of Oflx at 288 and 331 nm were observed only in (c) for the three sized nanocarriers, showing the conjugation of Oflx with the NPs.