
Figure 6.
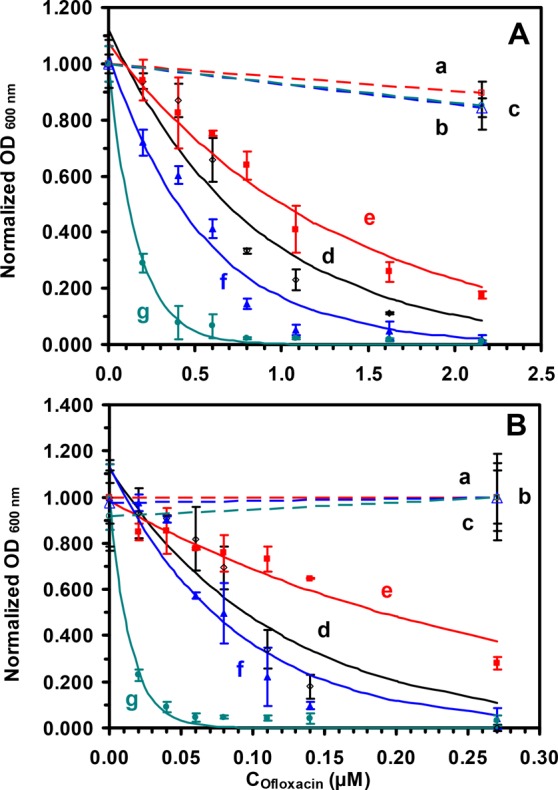
Dose, size, and MexAB-OprM dependent inhibitory effects of antibiotic nanocarriers (AgMUNH-Oflx NPs) against (A) WT and (B) ΔABM cells. Plots of normalized OD600 nm of cells cultured for 17 h in the modified LB medium containing (a–c) AgMUNH2 NPs (absence of Oflx, control), (d) Oflx alone, and (e–g) Oflx conjugated with the (e) 2.4 ± 0.7, (f) 13.0 ± 3.1, and (g) 92.6 ± 4.4 nm Ag NPs, respectively. The concentration of AgMUNH2 NPs in (a–c) of (A) and (B) contain the same concentration of NPs as the nanocarriers with the highest Oflx concentrations in (e–g) for each type of NP in (A) and (B) but without carrying Oflx (control experiments for the study of effects of NPs). The points are experimental data, and a solid line was generated by fitting the experimental data with the equation y = a·e–bx as followings: (A): (d) y = 1.12·e–1.18x, R2 = 0.923; (e) y = 1.07·e–0.764x, R2 = 0.967; (f) y = 1.04·e–1.82x, R2 = 0.964; (g) y = 0.998·e–6.07x, R2 = 0.997. (B): (d) y = 1.12·e–8.59x, R2 = 0.892; (e) y = 0.984·e–3.58x, R2 = 0.938; (f) y = 1.13·e–11.35x, R2 = 0.920; (g) y = 0.997·e–68.82x, R2 = 0.989. Concentrations of Oflx (MIC, IC50) for free Oflx and Oflx conjugated on a given sized nanocarrier were determined using the exponential fitting equation at the half of the maximum of the normalized OD600 nm for each curve, respectively.