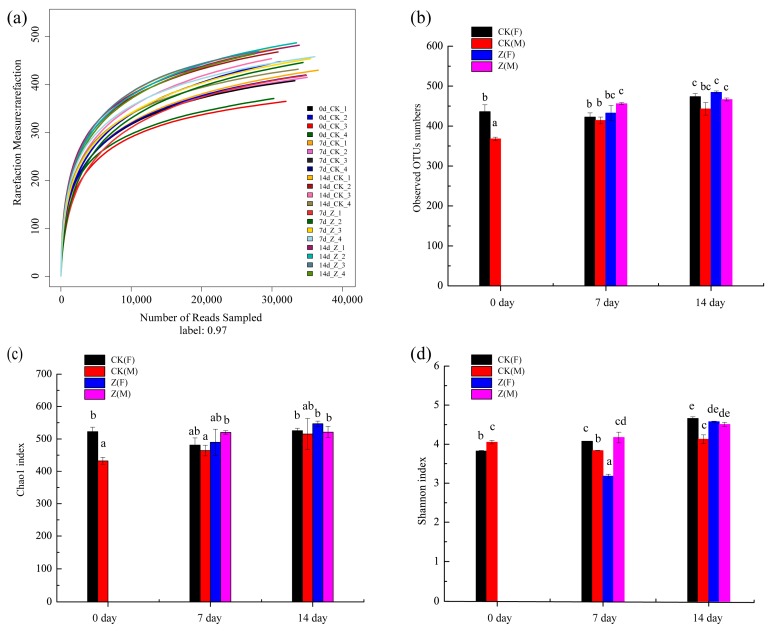
Figure 2.
Rarefaction curves and diversity of the normal control (CK) and HAHp(3.0)/ZnO NPs treated (Z) specimens at 0 day, 7 day, and 14 day. (a) Rarefaction curves, numbers 1 and 2 represent female (F) specimens and numbers 3 and 4 represent male (M) specimens. Horizontal coordinate represents the number of sequencing reads randomly sampled and the longitudinal coordinate means the number of operational taxonomic units (OTUs) observed; (b) comparison of observed OTUs numbers among CK and Z specimens based on sex; (c) community richness based on the Chao1 index; (d) community diversity based on the Shannon index. Different lowercase letters in (b–d) indicate significant differences among specimens (p < 0.05).

