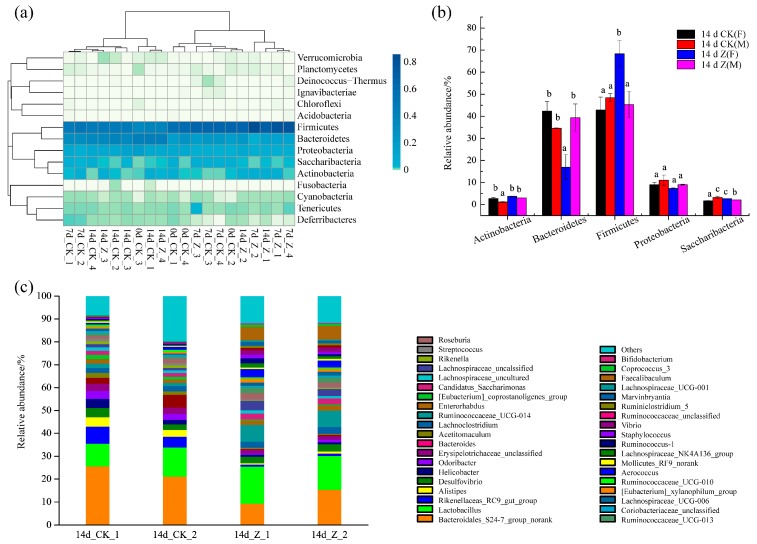
Figure 4.
Structure and relative abundance of intestinal microbiota at the phylum and genus levels. (a) Intestinal microbiota composition of all of the specimens at 0 day, 7 day, and 14 day at the phylum level. Numbers 1 and 2 represent the female (F) specimens and numbers 3 and 4 represent male (M) specimens; (b) comparison of relative abundance of dominant bacteria at the phylum level between the normal control (CK) and HAHp(3.0)/ZnO NPs treated (Z) specimens at 14 day. The relative abundance was calculated from the abundance of 16S rRNA gene sequences assigned to each bacterial community using the Greengenes database. Different lowercase letters in each phylum bacteria indicate significant differences among specimens (p < 0.05); (c) composition of intestinal microbiota at the genus level for the female specimens of 14d_CK_1 and 14d_CK_2 and 14d_Z_1 and 14d_Z_2.

