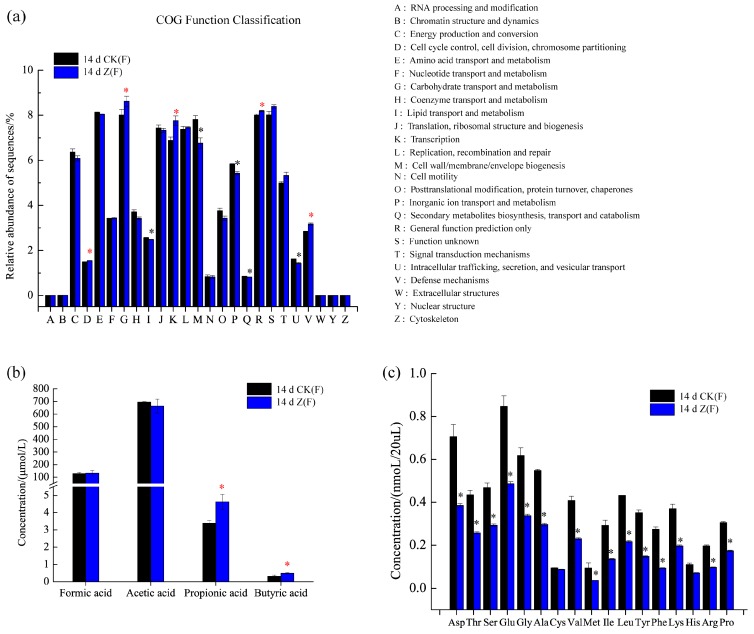
Figure 5.
Comparison of function prediction, short-chain fatty acids (SCFAs) and amino acid concentrations in feces of female mice between 14 d CK(F) and 14 d Z(F). (a) Function prediction using Clusters of Orthologous Groups of proteins (COG) orthology; (b) SCFAs concentration; (c) amino acid concentrations of aspatic acid (Asp), threonine (Thr), serine (Ser), glutamic acid (Glu), glycine (Gly), alanine (Ala), cysteine (Cys), valine (Val), methionine (Met), isoleucine (Ile), leucine (Leu), tyrosine (Tyr), phenylalanine (Phe), lysine (Lys), histidine (His), arginine (Arg), and proline (Pro). An asterisk represents a significant difference between 14 d CK(F) and 14 d Z(F) in relative abundances or SCFAs, and amino acid concentrations (p < 0.05). The red and black asterisks in (a) represent significantly decreased and increased relative abundances, respectively. The red asterisks in (b) indicate significantly increased SCFAs concentrations. The black asterisks in (c) indicate significantly decreased amino acid concentrations.

