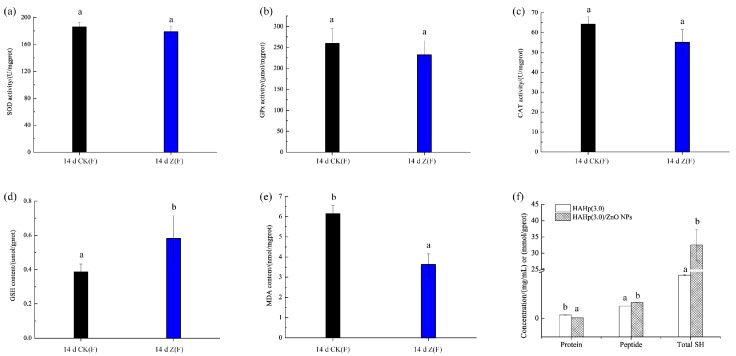
Figure 6.
Comparison of liver oxidative status between 14 d CK(F) and 14 d Z(F) after 14 days of oral gavage at a dose of 1.0 g/kg body weight. (a) Total activity of superoxidase dismutase (SOD); (b) activity of glutathione peroxidase (GPx); (c) activity of catalase (CAT); (d) glutathione (GSH) stock content; (e) malonaldehyde (MDA) content. In (a–e), each group contained five animals. Different lowercase letters indicate significant differences compared between 14 d CK(F) and 14 d Z(F) (p < 0.05). (f) Concentrations of protein, peptide and total sulfhydryl (SH). Different lowercase letters in protein, peptide and total SH indicate significant differences compared between HAHp(3.0) and HAHp(3.0)/ZnO NPs (p < 0.05).

