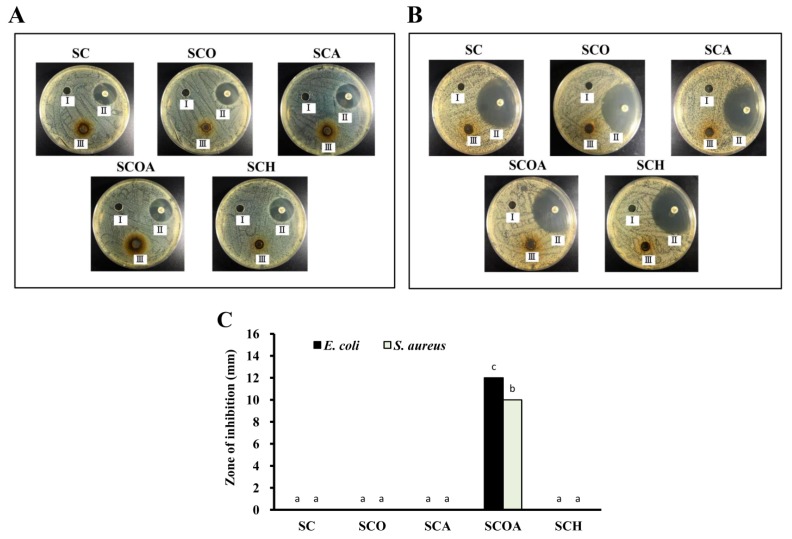
Figure 4.
Zone of inhibition of: (A) Escherichia coli; and (B) Staphylococcus aureus for SC, SCO, SCA, SCOA, and SCH. I (acetate buffer), II (antibiotic), and III (polysaccharide sample) are shown in each dish; (C) The bar graph summarizes the three separate antibacterial experiments and shows the zone of inhibition according to treatments. Results are shown as mean ± SD of three independent experiments. Different letters (in a, b, and c) mean statistically significant differences at p < 0.05. Differences exist between columns labeled with different letters, p < 0.05.

