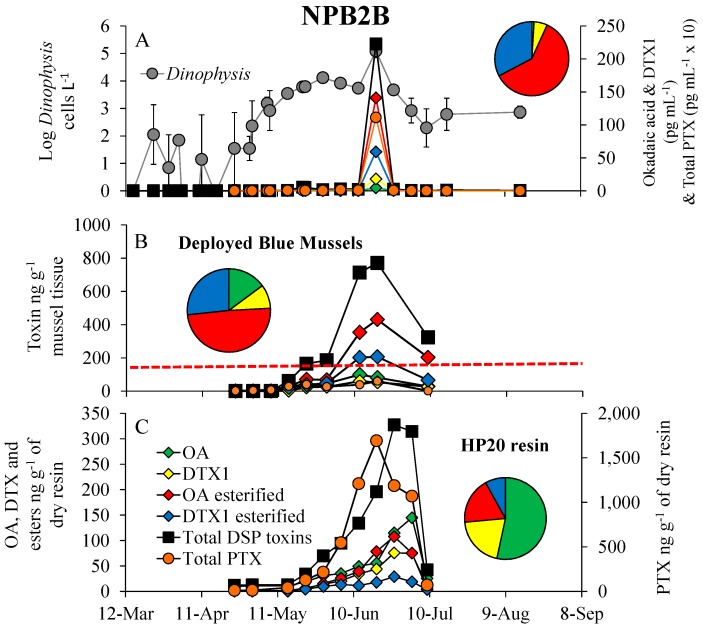
Figure 4.
(A) Log Dinophysis densities (cells L−1), the DSP toxins, okadaic acid (OA) dinophysistoxin 1 (DTX1) and their esters (pg mL−1) and total pectenotoxins (PTX; pg mL−1 × 10) for NPB2 (Britannia) located in Northport Harbor, during 2012. (B) Dynamics of the DSP toxins, OA, DTX1 and their esters, as well as total pectenotoxins (ng g−1) in blue mussels (Mytilus edulis) hung for monitoring purposes. The red line indicates USFDA action level (160 ng g−1 shellfish tissue). (C) DSP toxins (OA, DTX1 and esters) and pectenotoxins (ng g−1 of dry resin) adsorbed by SPATT samplers containing HP20 resin that were hung alongside mussels bags in Northport Harbor. Pie chart insets represent the percent of total toxin each DSP congener represents (colors as in bottom panel). For Dinophysis densities, points are means while error bars represent the standard deviation of duplicate samples. For all toxin samples, points represent the value of a single sample. For shellfish, points represent 15–20 individuals pooled prior to toxin analysis.

