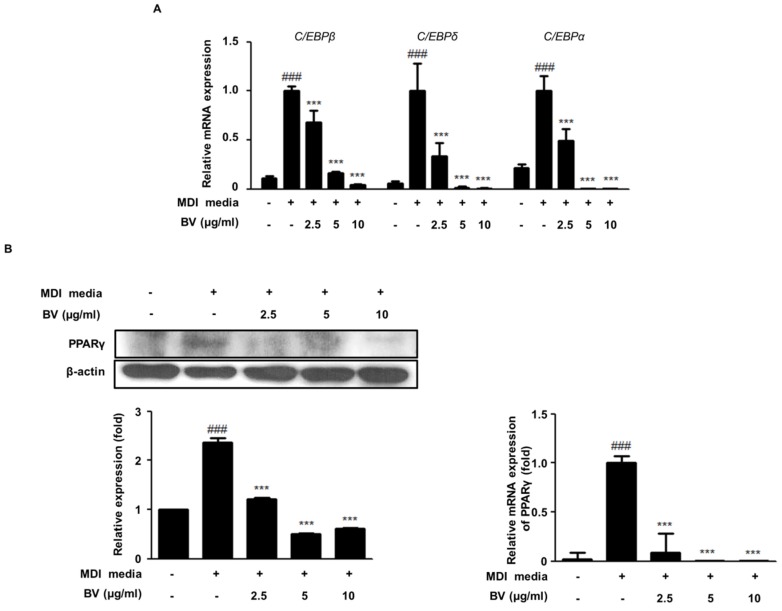
Figure 2.
The effects of BV on the expression levels of lipid metabolism and adipogenesis in 3T3-L1 cells. (A) The mRNA levels of C/EBPβ, C/EBPδ, and C/EBPα were measured by qRT-PCR. (B) The protein and the mRNA expression levels of PPARγ were determined by Western blot analysis or by qRT-PCR. β-actin was used as an internal control. ### p < 0.001 vs. non-differentiation cells, *** p < 0.001 vs. differentiation cells.

