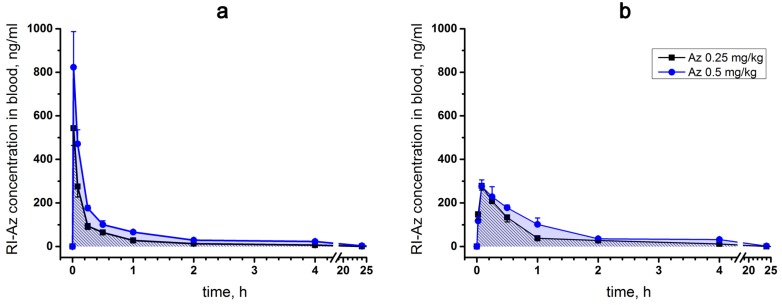
Figure 6.
Pharmacokinetic curves of [125I]-Az concentration in blood of male ICR mice 0–24 h after its (a) intravenous and (b) intramuscular administration at doses of 0.25 and 0.5 mg/kg. The results are presented as mean values ± SD, n = 5 (each plot point represents mean results for five animals).

