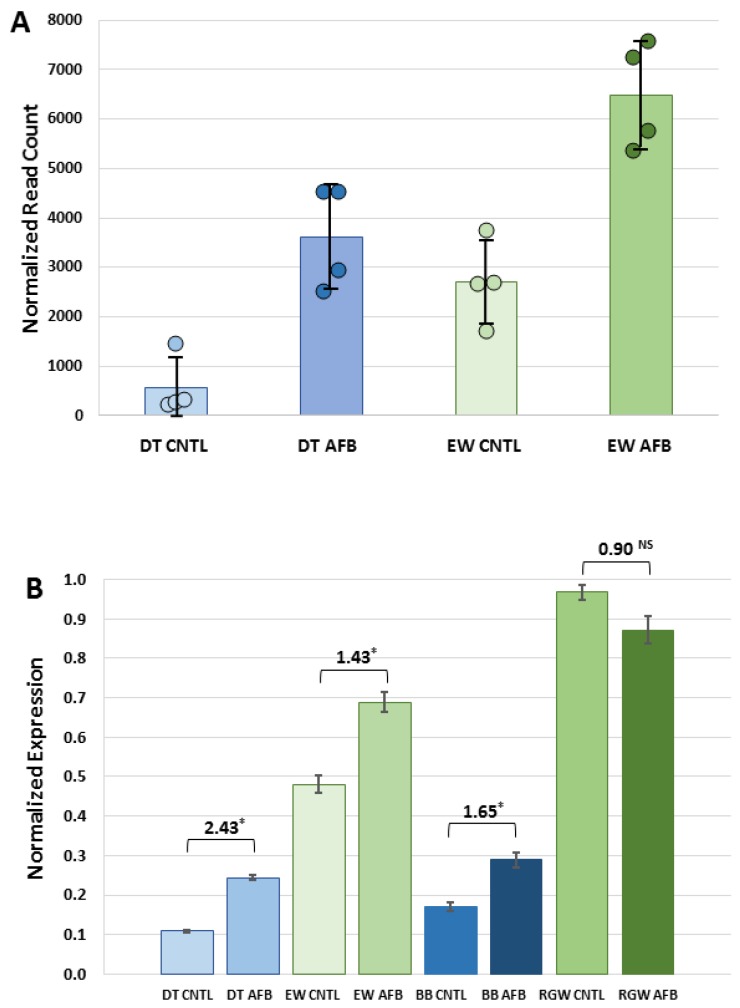
Figure 4.
Effect of AFB1 on expression of GSTA3 in the livers of turkeys. (A) Mean normalized RNA-seq read counts. For each treatment group, individual read counts are indicated by closed circles. Error bars denote standard deviation of the mean. (B) Relative expression as measured by qRT-PCR. For each group the fold change (ΔΔCt) between AFB1-treated and control birds is given. Asterisks denote significant comparisons (p-value < 0.01).

