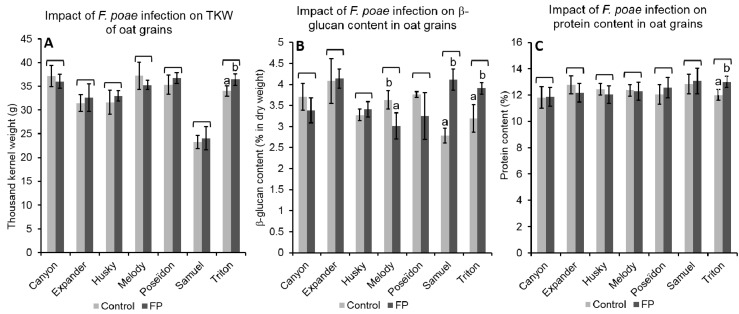
Figure 4.
Average and standard deviations of (A) the thousand kernel weight (TKW), (B) β-glucan contents, and (C) protein contents in grains from plots without (Control) or with F. poae (FP) inoculation, for seven oat genotypes and over all three environments (field sites). All of the trials were done with three replicates. Different letters on the top of the columns indicated significant differences between infected and non-infected grains of a given genotype, according to Tukey HSD (α = 0.05).

