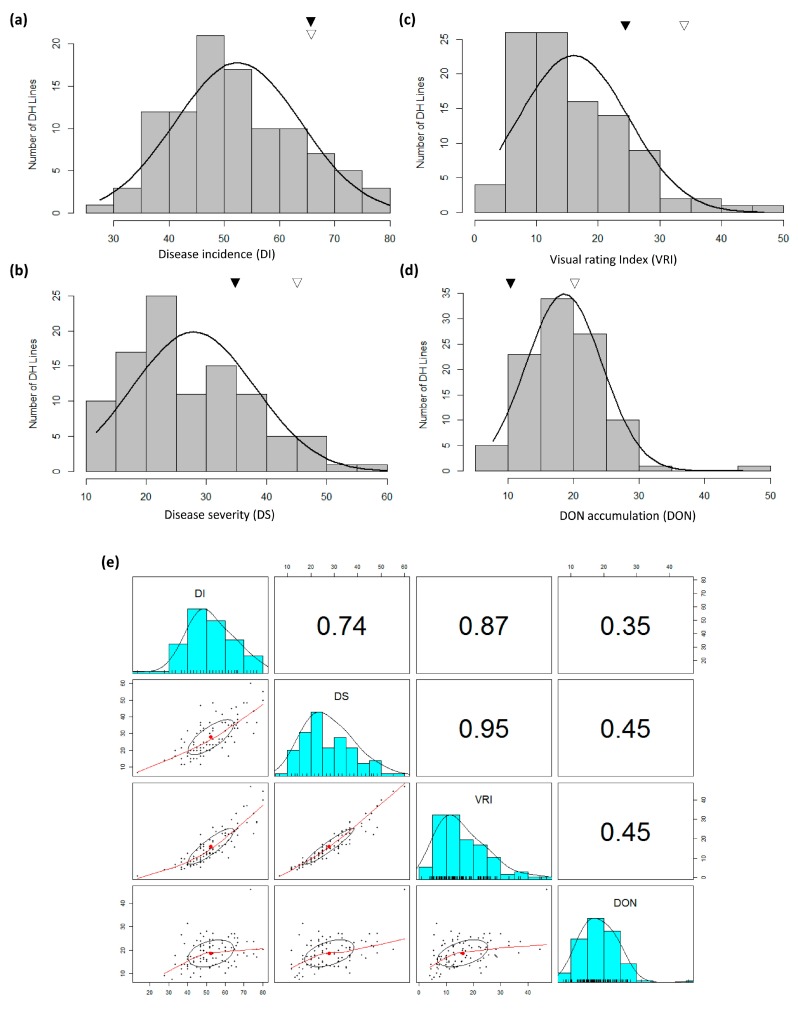
Figure 2.
Frequency distribution of 100 doubled haploid lines of triticale genetic mapping population produced from a biparental cross between TMP16315 and AC Ultima for mean of four FHB traits namely: (a) (DI, %), (b) (DS, %), (c) (VRI, %) and (d) (DON, ppm) content evaluated at Ottawa. The means of the parental genotypes are indicated over graphs by triangles (AC Ultima, hollow triangle; TMP16316, solid triangle). (e) Scatterplot of above four FHB traits (DI, DS, VRI and DON) evaluated at Ottawa. Correlation coefficients (top diagonals) and regression line (lower diagonals) deciphered relationship among different traits studied.

