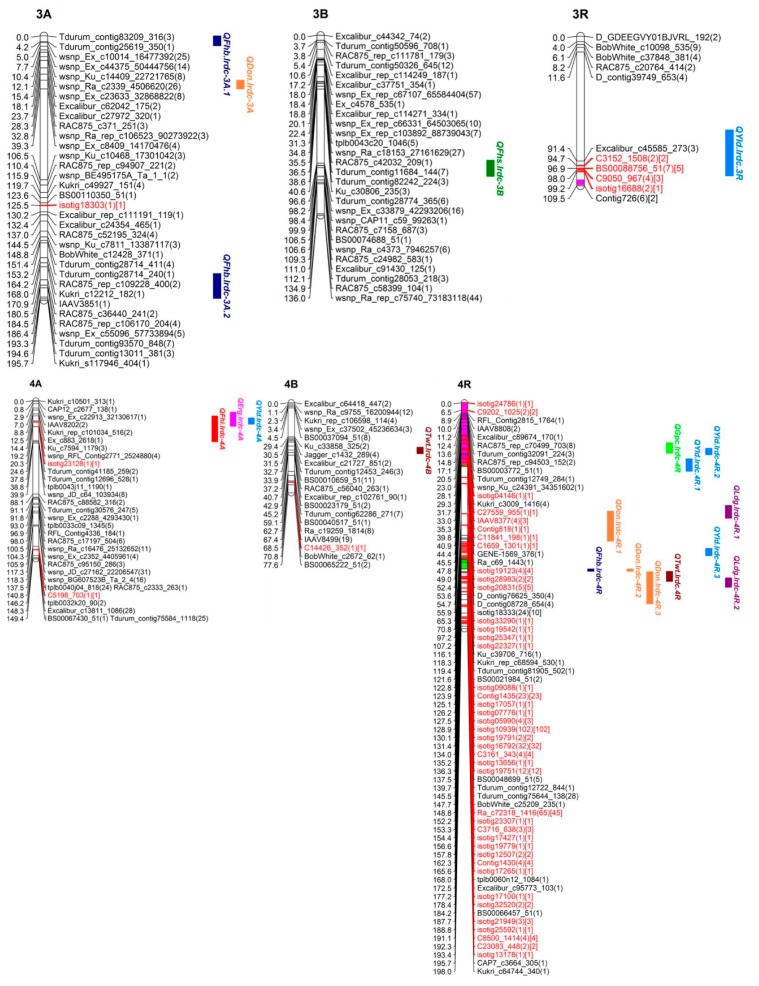
Figure 5.
Homoeologous groups 3 and 4 SNP map of TMP16315/AC Ultima triticale DH population. Loci on chromosome maps are represented by unique markers. Marker names in black and red colors represent genomic regions largely dominated by SNPs derived from wheat genomes A/B/D and rye genome R, respectively. Numbers in round brackets represents total number of SNPs at the locus and number in square brackets represents SNPs derived from R genome. Colored chromosome bar indicates interchanged/translocated fragment (pink: chromosome (chr) 6R; green: chr 7R; brown: mosaic of chrs. 1, 2, 4, 5, 6 and 7). The QTL for different traits are given on the right side of maps.

