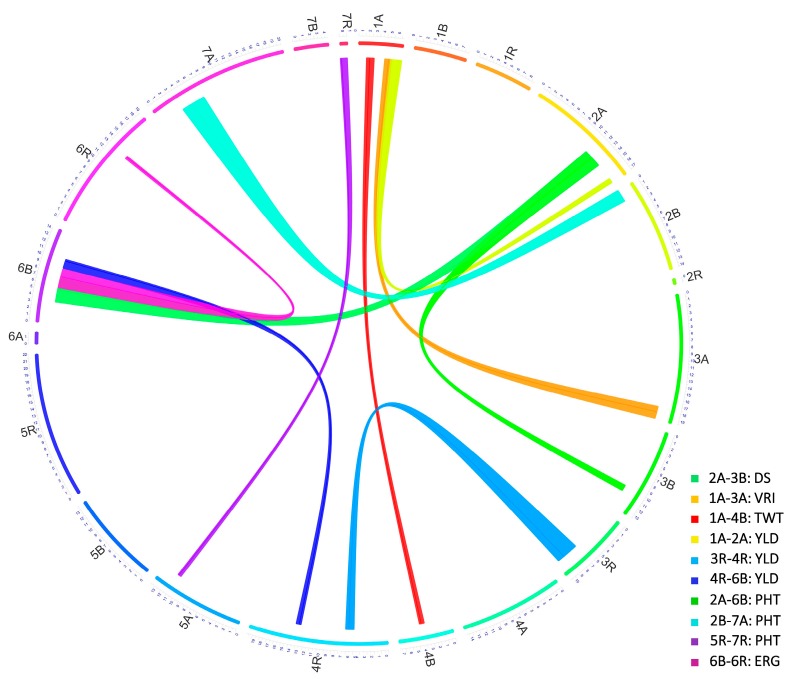
Figure 8.
Epistasis QTL network. Circular plot represents the hexaploid triticale genome arranged in chromosomes (chrs) 1–21 (1A-7R) in clockwise direction in Circos diagram. Numbers on colored outer circle represents cM on respective chrs. Colored connections represent epistasis loci (QTL) controlling different traits (DS, VRI, TWT, YLD, PHT, ERG) and the widths of connections on respective chrs represent QTL intervals.

