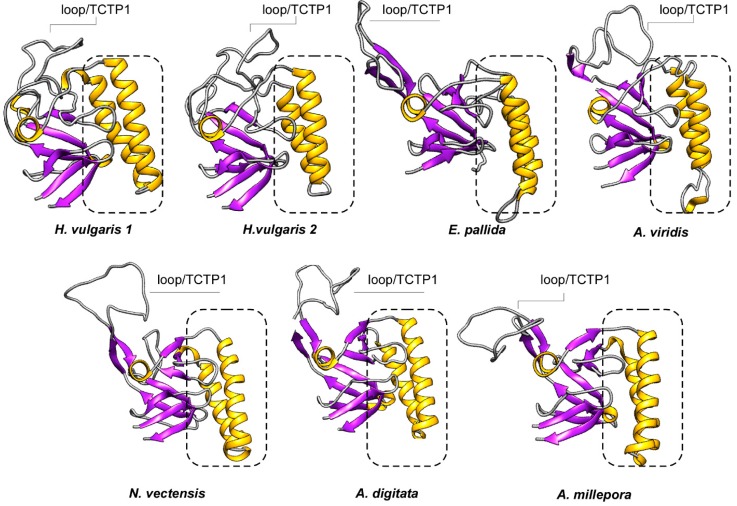
Figure 4.
Ribbon diagrams of the cnidarian TCTP structures herein defined. General overview of the 7 TCTPs generated by homology modelling. The 3D structures were created via the Phyre 2 software [41] and rendered by using Chimera package [45]. The proteins were coloured according to secondary structure with beta-sheets in purple and helices in yellow. The dotted rectangles identify the helical hairpin forming the microtubule and Ca2+ binding domain.

