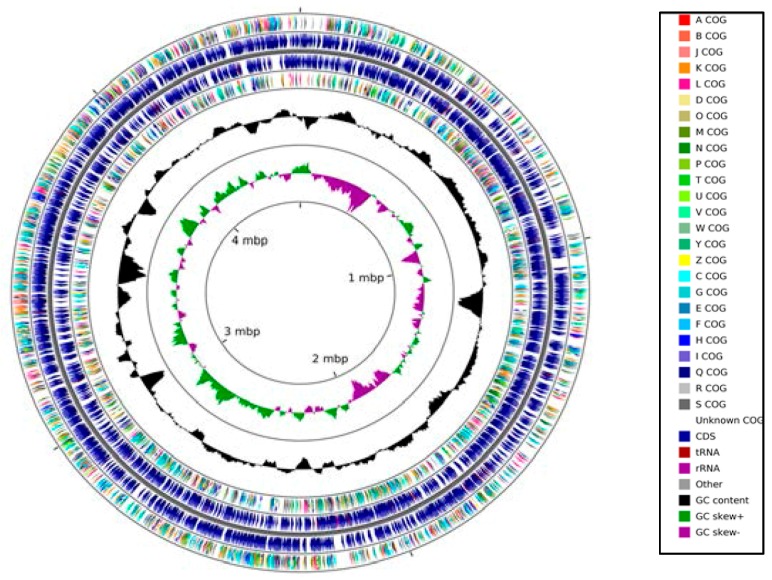
Figure 2.
Circular genome map of Arthrobacter sp. strain SRS-W-1-2016 with the first (outermost) and fourth rings depicting clusters of orthologous groups of proteins (COG) categories of protein coding genes on the forward and reverse strands, respectively. The second and third rings show the locations of protein coding, tRNA, and rRNA genes on the forward and reverse strands, respectively. The black plot depicts GC content with the peaks extending towards the outside of the circle representing GC content above the genome average, whereas those extending towards the center mark segments with GC content lower than the genome average. The innermost plot depicts GC skew. Both base composition plots were generated using a sliding window of 50,000 nt.

