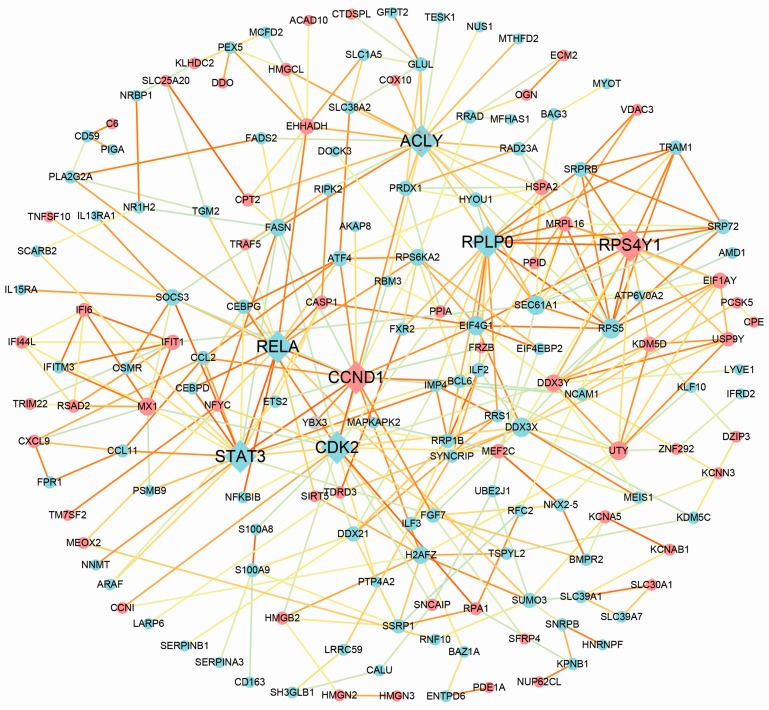
Figure 3.
Protein–protein interaction (PPI) network complex. A total of 167 DEGs (113 upregulated genes and 67 downregulated genes) were filtered into the PPI network. Red nodes suggest upregulated genes and blue node suggest downregulated genes. The node size is proportional to the edge degree. The edge color suggests the significance according to the p value (the brighter the color, the smaller the p value).

