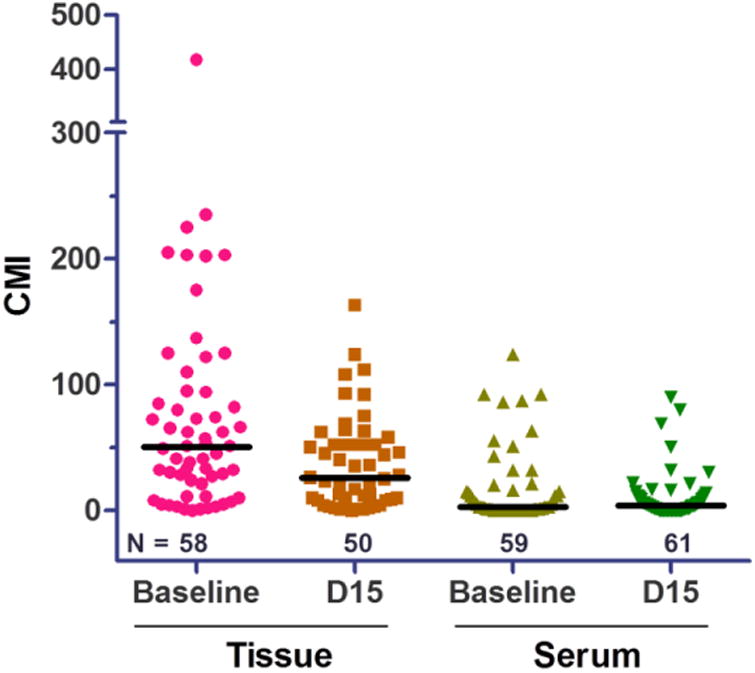
Figure 2. Tissue and Serum DNA Methylation.

QM-MSP and cMethDNA analyses were performed on tissue (n=58 baseline and 50 D15) and serum (n=59 baseline and 61 D15) samples, respectively. Scatter plots show CMI methylation levels as the sum of methylation for each marker in 10-gene panel. Median methylation is indicated (bar) and only samples with methylation values for all 10 genes were evaluated.
