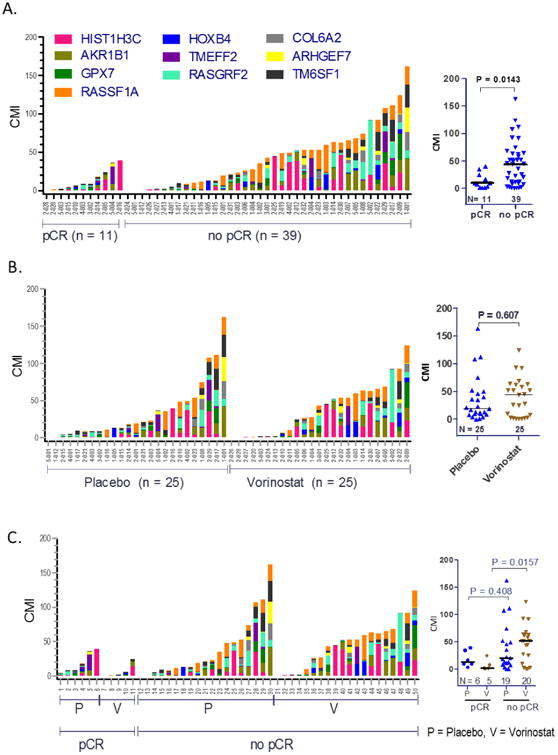
Figure 4. Tissue CMI at D15 by pCR Status and Treatment Arm.

CMI of the 10-gene panel is indicated by scatter plots for each treatment group (median shown as bar). For each individual sample (x-axis) the bar graphs indicate the level of CMI (height of the bar, y-axis) and the relative methylation of each gene (shown by colored segment). A. D15 methylation levels of tissue samples in pCR versus no pCR groups. B. D15 methylation levels of tissue and serum samples in vorinostat (V) versus placebo (P) groups. C. D15 methylation levels of tissue samples grouped pCR versus no pCR, ± vorinostat. Only samples having methylation values for all 10 genes were evaluated (nonparametric Mann-Whitney U test).
