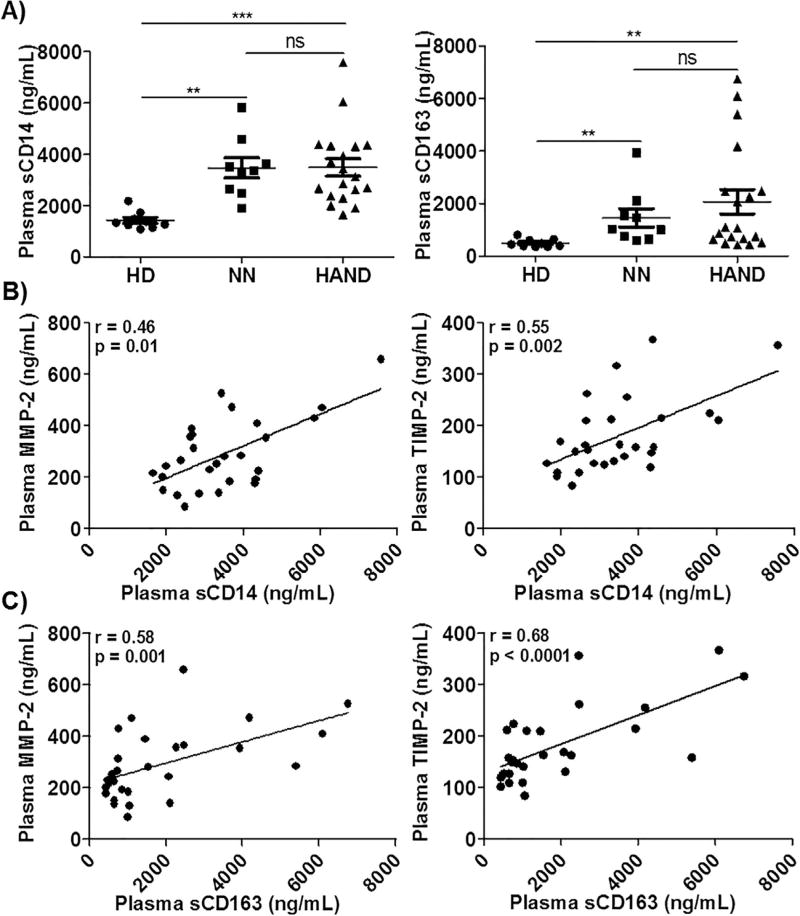
Fig. 6.
Correlations between MMPs and monocyte/macrophage activation markers in the peripheral blood of HIV-1 patients. A) Plasma samples from 9 HD, 9 NN, and 19 HAND individuals were subjected to ELISAs to determine the levels of sCD14 and sCD163 (ng/mL). Each dot in the plots represents data from a single individual. Lines represent mean ± SEM. B) and C) Correlation between plasma sCD14 or sCD163 and MMP-2 or TIMP-2. Significance was determined using the Spearman correlation test. Spearman correlation coefficient and p value (r and p) are indicated.

