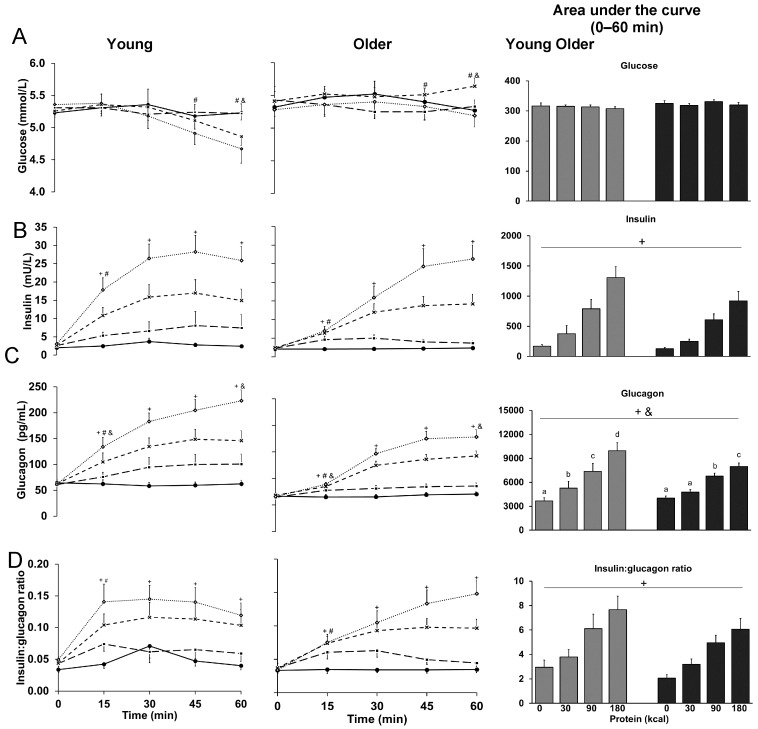
Figure 2.
Mean (±SEM) and area under the curve concentrations of blood glucose (A); plasma insulin (B); glucagon (C); and ratio of insulin to glucagon (D) in healthy younger (n = 10) and older (n = 10) men during intraduodenal infusions of saline (control; solid line with closed circles) and whey-protein loads of 30 kcal (7.5 g protein; dashed line with closed squares), 90 kcal (22.5 g protein; dashed line with crosses) and 180 kcal (45 g protein; dotted line with open diamonds). Effects of protein-load, age, and the interaction-effect of protein-load by age were determined using a mixed-effect model with baseline concentrations as a covariate and post-hoc Bonferroni correction. Statistical significance was accepted at p < 0.05. + p < 0.05 Effect of protein-load. Post-hoc tests: higher glucagon (AUC 0–60 min and 60 min) during 30 kcal protein infusion compared to control (AUC: p = 0.004, 60 min: p = 0.029); higher insulin, glucagon, and ratio of insulin to glucagon during 90 kcal and 180 kcal protein infusions compared to control (insulin: AUC: both p < 0.001, 60 min: both p < 0.001; glucagon: AUC: both p < 0.001, 60 min: both p < 0.001; ratio of insulin to glucagon: AUC: p < 0.001 and p = 0.002, 60 min: p = 0.001 and p < 0.001). # p < 0.05 Effect of age. & p < 0.05 Interaction-effect of protein-load by age. a, b, c, d p < 0.05 Interaction-effect post-hoc tests: a different letter indicates a difference between protein loads (AUC 0–60 min; ‡ p < 0.05, ‡‡ p < 0.01, ‡‡‡ p < 0.001): higher glucose in older than younger men at 60 min during 90 kcal protein infusion (‡‡), and in younger, but not older men, lower glucose concentrations (60 min) after the 90 kcal (‡) and 180 kcal (‡) protein infusions compared to control; lower glucagon in older than younger men at 15 min during 90 (‡) and 180 kcal (‡‡) protein infusions; in younger and older men, higher glucagon (AUC and 60 min) during 180 kcal protein infusion compared to 90 kcal (younger: ‡‡‡, older: ‡), 30 kcal (younger: ‡‡‡, older: ‡‡) and control infusions (younger: ‡‡‡, older: ‡‡), and 90 kcal protein infusion compared to 30 kcal (younger: ‡‡, older: p = ‡) and control infusions (younger: ‡‡‡, older: ‡‡‡); in younger (‡), but not older, men, higher glucagon (AUC and 60 min) during 30 kcal protein infusion compared to control.

