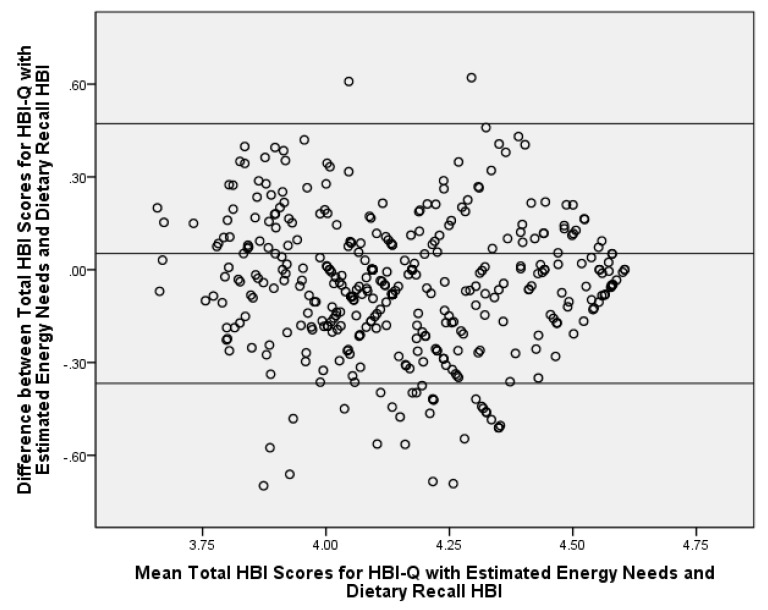
Figure 1.
Bland–Altman Analysis of the HBI-Q with Estimated Energy Needs vs. Dietary Recall Healthy Beverage Index (HBI) Scores for Total HBI Scores; Adults (n = 404) living in Southwest Virginia, United States, 2012–2016. All values are log-transformed. The center line represents the mean difference and the upper and lower lines indicate the mean ± 1.96 × standard deviation. HBI-Q, a method to rapidly determine Healthy Beverage Index scores.

