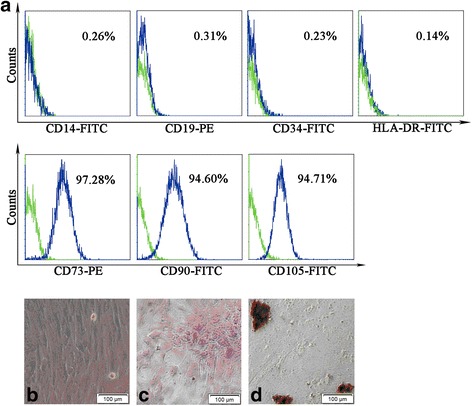
Fig. 2.

Confirmation of hPMSC characteristics by cell surface marker staining and differentiation capability of cells. Surface markers of hPMSCs measured by flow cytometry. a Green line in each histogram represents isotype control staining; specific expression of indicated cell surface marker presented as blue histograms. b–d Cells cultured under various conditions to differentiate to osteoblast or adipogenesis cells. b Normal hPMSCs show fibroblast-like morphology. c Osteoblasts confirmed by Alizarin Red staining; dark red staining shows calcium deposition. d Adipogenesis confirmed by accumulation of neutral lipid vacuoles inside cells with Oil Red O stain. Scale bar: 200 μm. Magnification × 200
