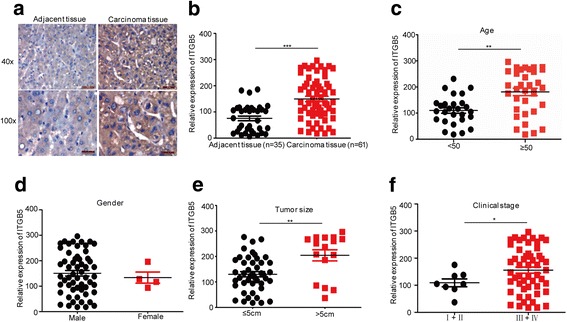
Fig. 2.

ITGB5 had high expression in HCC. a–b The expression levels of ITGB5 in HCC tissues and adjacent normal tissues were analysed by immunohistochemistry. The expression levels of ITGB5 were analysed in 61 HCC tissues and 35 adjacent normal tissues. Data represent the mean ± SD of three independent experiments. ***p < 0.001 vs. control. c–f Correlation analyses of ITGB5 expression with the patient age, gender, tumour size and clinical stage in the 61 HCC tissues. Data represent the mean ± SD of three independent experiments. *p < 0.05, **p < 0.01 and ***p < 0.001 vs. control
