
Fig. 5.
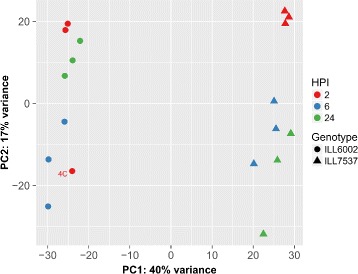
Principal component analysis of the variance-stabilized estimated raw counts. Samples are categorized by Genotype (as marker shapes) and Hours post inoculation (HPI, marker colour)
Official websites use .gov
A
.gov website belongs to an official
government organization in the United States.
Secure .gov websites use HTTPS
A lock (
) or https:// means you've safely
connected to the .gov website. Share sensitive
information only on official, secure websites.
Principal component analysis of the variance-stabilized estimated raw counts. Samples are categorized by Genotype (as marker shapes) and Hours post inoculation (HPI, marker colour)