Fig. 1.

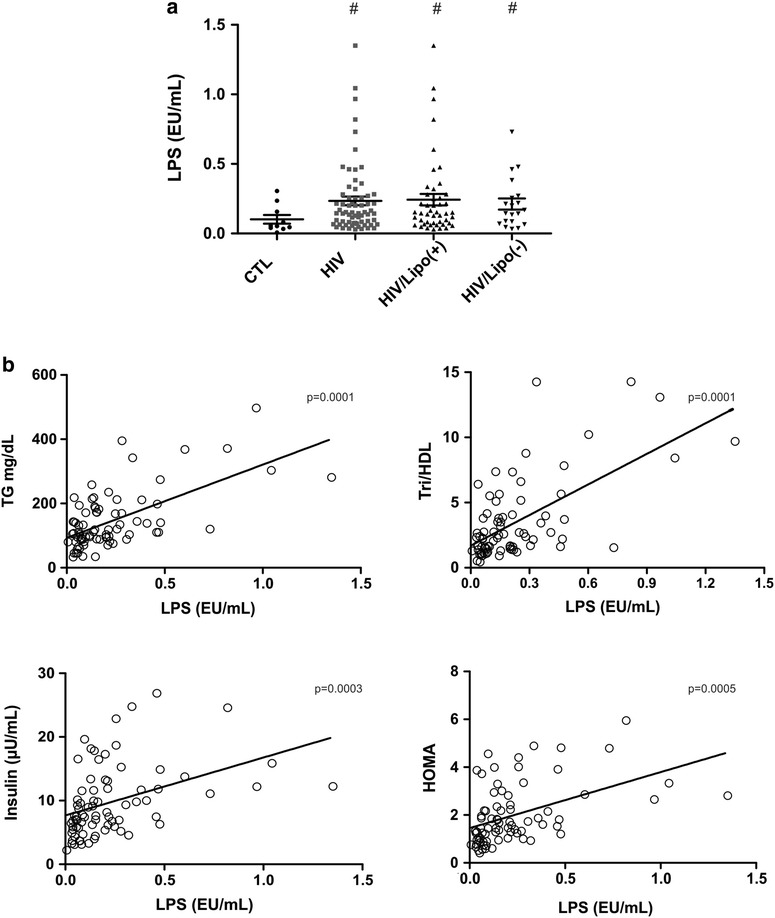
Circulating levels of LPS and Spearman correlation between circulating LPS leaves and selected insulin resistance index. a LPS circulating levels in controls (CTL), HIV patients, HIV patients with lipodystrophy (HIV/Lipo(+)) and without lipodystrophy (HIV/Lipo(−)) #p < 0.05 vs. control. b Correlation between LPS and TG (Triglycerides) (r = 0.49, p = 0.0001), between LPS and TG/HDL (r = 0.50, p = 0.0001), between LPS and insulin (r = 0.52, p = 0.0003), and between LPS and HOMA-IR (r = 0.52, p = 0.0005), in the entire group. O: HIV patients
