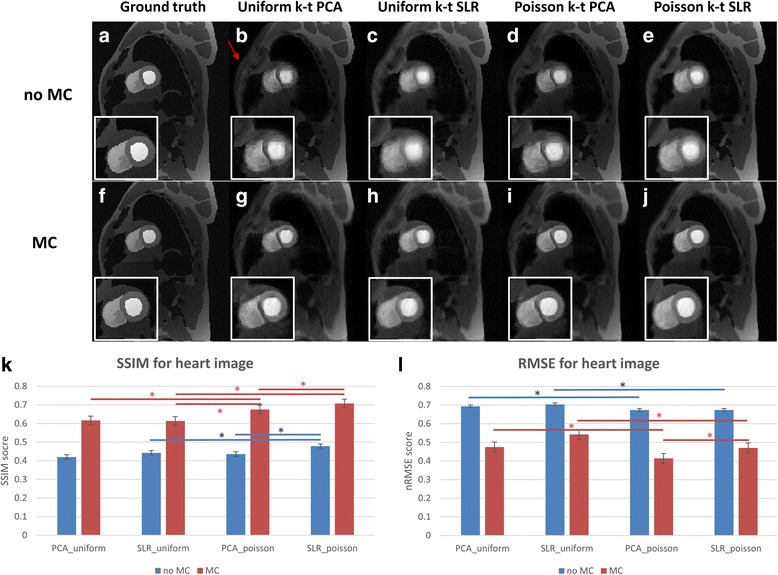
Fig. 3.

CMR-XCAT phantom of uniform and Poisson disc undersampling reconstruction with and without motion correction. The top part of the figure shows one static frame image results, and the first row corresponds to the ones without motion correction while the second row refers to the ones with motion correction. Each column represents the fully sampled ground truth (a, f), results from uniform undersampling using k-t PCA (b, g), k-t SLR (c, h), Poisson disc undersampling using k-t PCA (d, i) and k-t SLR (e, j). The red arrow indicates 1 example of the aliasing caused by undersampling. (k) and (l) are statistic SSIM and normalized RMSE scores comparing the above 4 methods with the fully sampled ground truth among all frames. * indicates p < 0.05. All the motion corrected results have significant higher SSIM (p < 0.05) and significant lower RMSE (p < 0.05) compared to the ones without motion compensation (not shown). CMR, cardiovascular magnetic resonance; PCA, principal component analysis; SLR, sparcity and low rank structure; SSIM, structural similarity index; XCAT, extended cardiac torso
