Fig. 4.

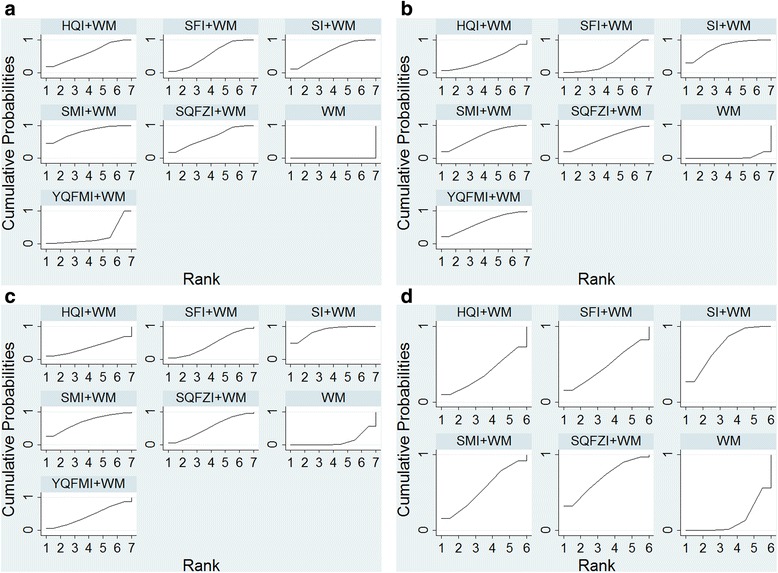
Plot of the surface under the cumulative ranking curves for all treatments on the clinical effective rate, LVEF, CO and SV. Note: a: the clinical effective rate; b: LVEF; c: CO; d: SV

Plot of the surface under the cumulative ranking curves for all treatments on the clinical effective rate, LVEF, CO and SV. Note: a: the clinical effective rate; b: LVEF; c: CO; d: SV