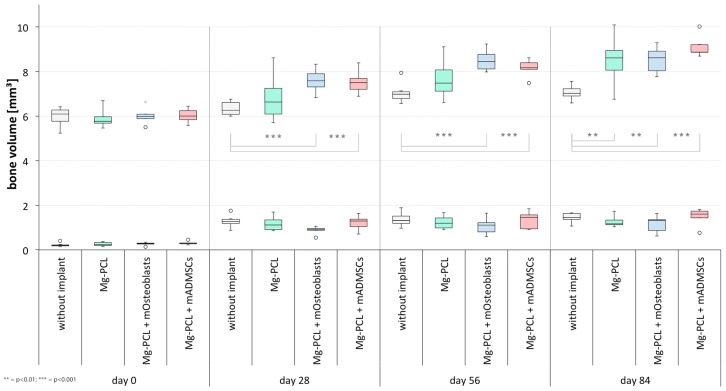
Figure 7.
Comparative presentation of the formation of bone volume on the defect treated right side (lower row) and untreated left side (upper row) between the experimental groups at days 0, 28, 56 and 84 (** = p < 0.01; *** = p < 0.001; whiskers = minimal and maximal values; horizontal line = median; circles = outliers).

