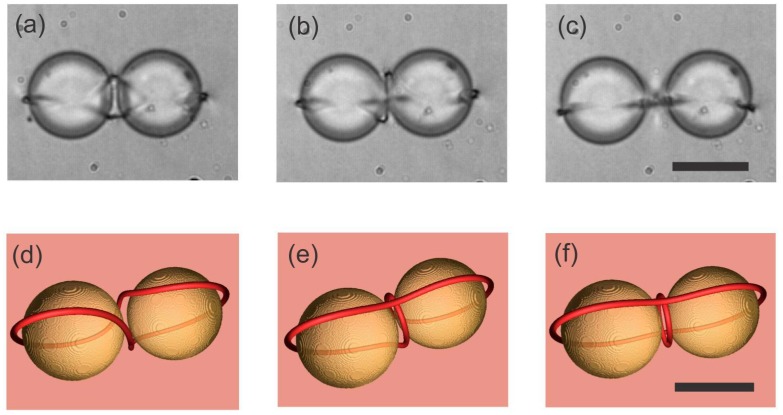
Figure 13.
Entangled colloidal pairs appear in three different configurations. (a) Figure of 8, observed in the experiment, and (d) LdG simulation. (b) Figure of Omega in the experiment and (e) LdG simulations. (c) Entangled point defect in the experiments and (f) theory. Scale bar in (a–c), 20 µm. Scale bar in (d–f), 1 µm. Adapted from Ref. [86].

