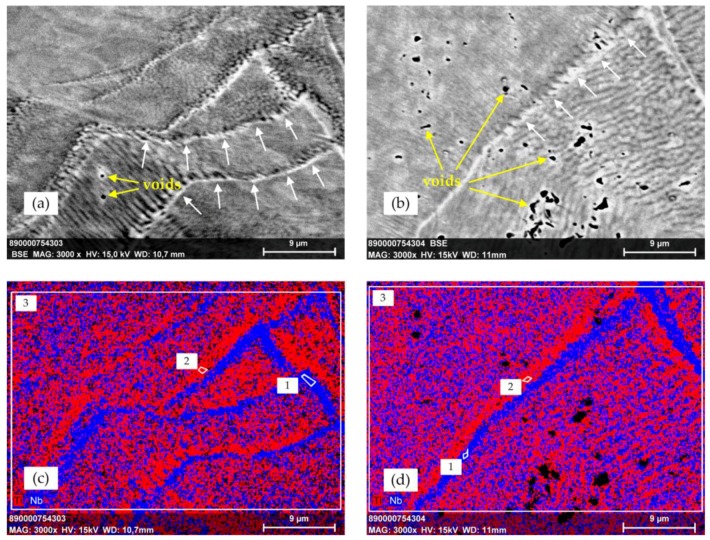
Figure 10.
Scanning electron microscope images (a,b; BSE mode) and energy dispersive X-ray spectrometer (EDX) mapping (c,d) of polished cross-sections of Ti-42Nb compression specimens 10 (a,c) and 3 (b,d) after compression tests at 3000× magnification. The images (a,b) display structures that may be identified, for e.g., grain boundary formation and sliding bands, respectively, indicated by white arrows. The encountered structure sizes are in the range of few microns. For specimen 10 (a), only a few very small voids with diameter in the sub-micron range are observed, whereas a recurrent pattern of voids (up to 2 µm) is found for specimen 11 (b). The images (c,d) display a partially de-mixed microstructure with Ti- (red) and Nb-rich spots (blue). A spatial separation of Ti and Nb along the encountered structures is ascertained in both samples.

