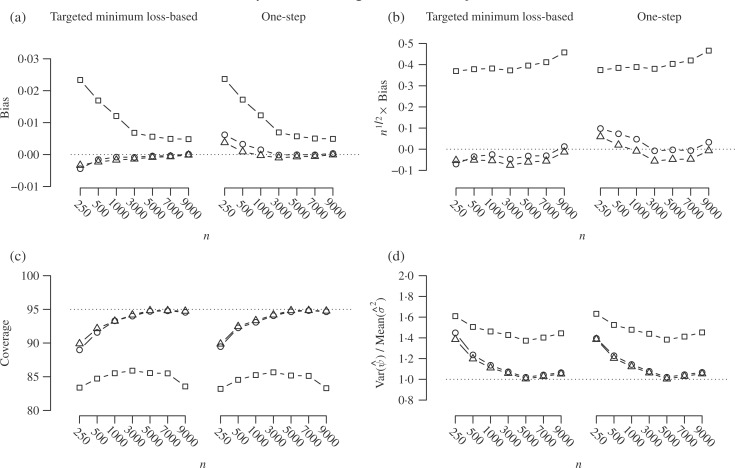
Fig. 1.
Simulation results when only the outcome regression is consistently estimated, with
the following performance measures plotted against the sample size
 : (a) bias; (b)
 bias; (c) coverage of
95% confidence intervals; (d) accuracy of the standard error estimator. Squares
represent estimators that do not account for inconsistent nuisance parameter
estimation, circles represent estimators using the bivariate correction of van der Laan (2014), and triangles represent
estimators using the proposed univariate corrections.

