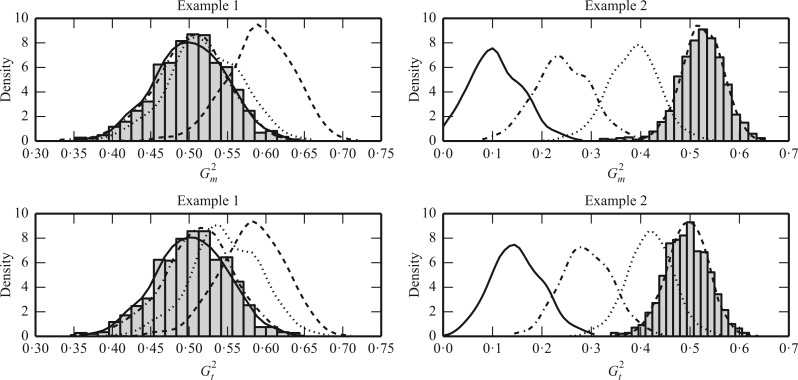
Fig. 1.
Sampling distributions of  and
and
 under the two models
described in §2.5 with
  for
for
 (dashed),
1
 5 (dotted),
2
 5 (dot-dash) and
3
 5 (solid). The density function
in each case is estimated by the histogram. The sampling distributions of
 and
and
 with the empirical
Bayes selection of
  are shaded grey and
overlaid on top of the other density functions.

