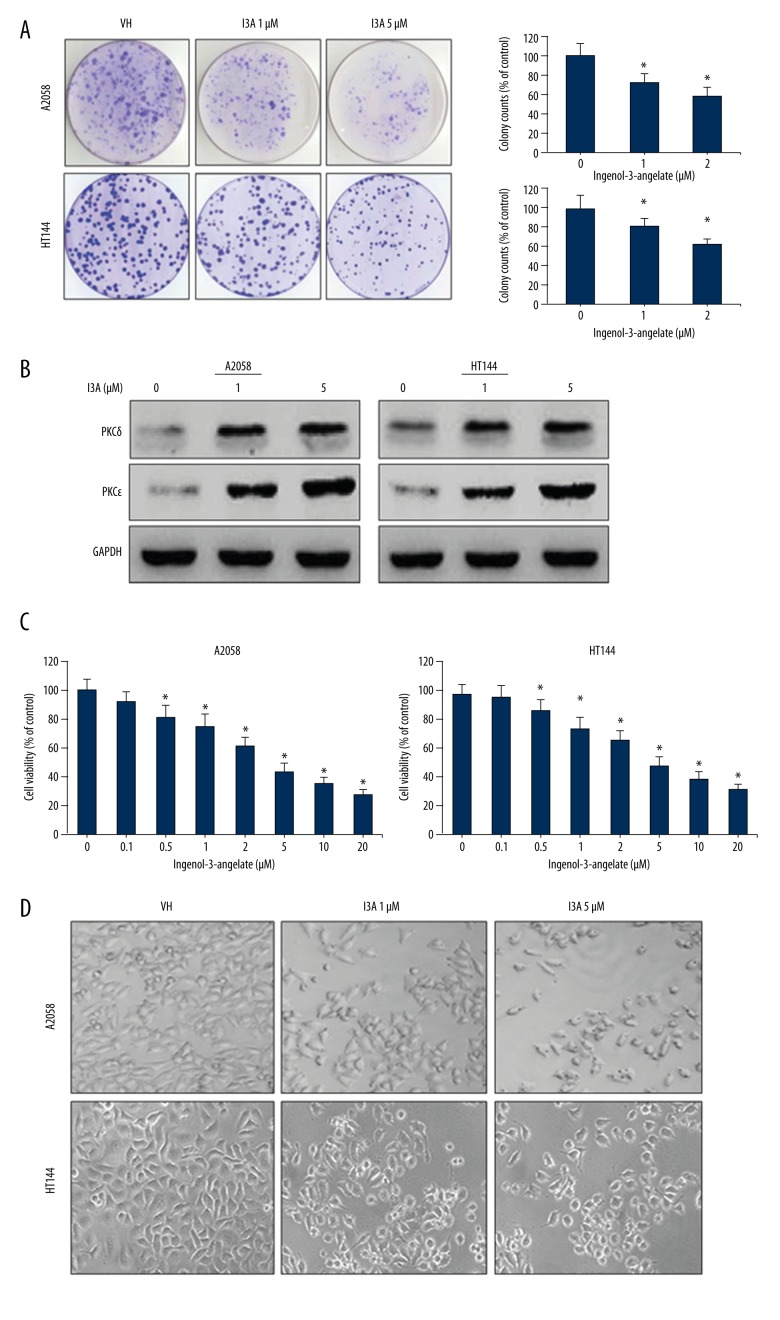
Figure 1.
Effect of I3A on cell survival and proliferation. (A) A2058 and HT144 cells were treated with I3A at indicated concentrations and cell viability as assayed by MTT. Cell viability is represented as percent of control. (B) A2058 and HT144 cells treated with or without I3A were visualized under a light microscope (40×). (C) A2058 and HT144 cells treated with or without I3A and clonogenic assay was performed. Percent colony formation is represented as compared to control. (D) Western blot analysis of PKC protein isoforms from A2058 and HT144 cells treated with or without I3A. Each quantitative experiment was performed in triplicate. I3A – ingenol-3-angelate; * P<0.05 vs. control.

