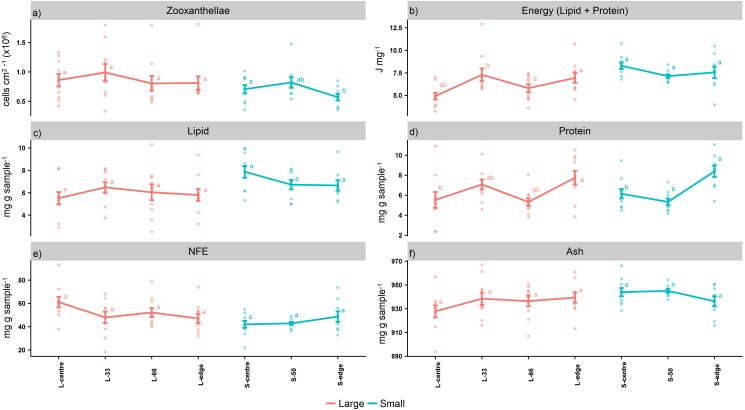
Figure 2. Proximate composition, energy content, and zooxanthellae density of distal intracolonial locations in two size classes of Acropora millepora colonies.
(A) Total lipid concentration, (B) Total protein concentration, (C) Total nitrogen-free extract concentration (NFE), (D) Total ash concentration, (E) Zooxanthellae density, (F) Energy content (using caloric enthalpies of lipid + protein). L-centre: larger colony centre, L-33: 33.3% of the longitudinal radius length, L-66: 66.6% of the longitudinal radius length, L-edge: larger colony edge, S-centre: smaller colony centre, S-50: 50% of the longitudinal radius length, S-edge: smaller colony edge (S-edge). Values are presented as means ± SEM. Letters in common denote no significant difference (P < 0.05). For each size class, n = 10.

